
Building a Better Analytics Organization - The Solution (Part 6)
Jun 04, 2022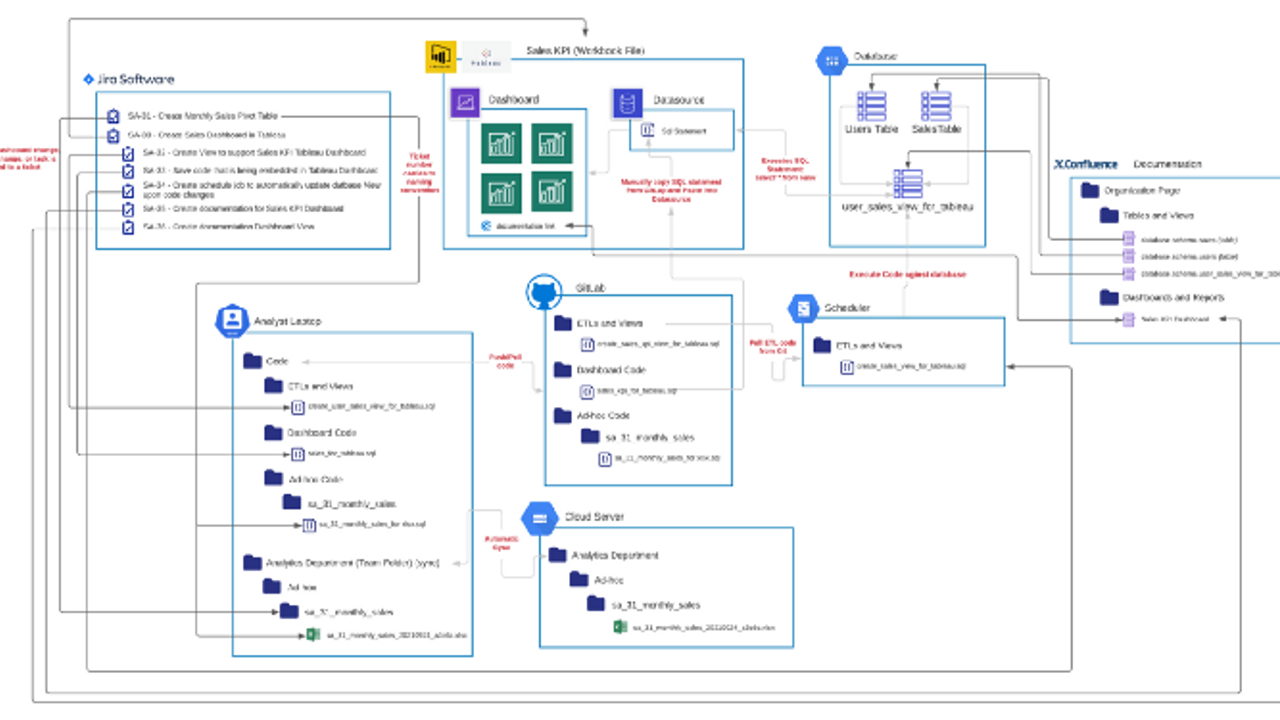
Welcome to Part 6 of Building a Better Analytics Organization. So far, we’ve discussed:
Part 1 — Introduction, common tasks, and an introduction to challenges for an individual and for a team
Part 2 — Overview of the common areas where problems can occur and the specific problems that individuals and teams face
Part 3 — Details of specific problems when working with code
Part 4 — Details of specific problems when working with visualizations
Part 5 — Details of specific problems when working with tables and views
Part 6 — How to solve the challenges
Part 7 — Implementation tips
If you’re new to this series, I’d encourage you to read up on the previous articles otherwise there’s a chance that you might be looking at this article about solutions and begin to think that this seems like overkill. But if you have been following along, this article is going to introduce you to a comprehensive solution to solve all of the problems that we previously discussed.
Solution Introduction
Before we dive into the specifics, I’d like to provide a bit of context to help put your mind at ease. What I’m about to describe may look a bit daunting and it may feel overwhelming or possibly feel unnecessary. However, we covered a lot of challenging areas and many more specific problems that you and your team is facing right now. To solve these problems and overcome these challenges, we’re going to needs solutions, not just a solution because there isn’t one magical tool or practice that can fix everything.
To help make the solutions easier to understand, I’ve structured this article in a manner that will provide you with a 10,000 ft view of the complete picture. Hopefully this will provide you with some context of what we’re about to embark on. From this view, I will provide additional details about the purpose of each of the software or process solutions that we’ll use. And in following articles, I provide the specific details about how each component is connected to the other, the best practices to use, and what could go wrong. But before I go there, there’s one more thing that need to be discussed: Sales objections.
Sales Objections
No, I’m not trying to sell you on anything from a monetary perspective, but I am trying to communicate (I guess that you could say, sell ) my concepts and what I’ve built at many different companies throughout my career. And if you agree with the problems that we’ve discussed and believe in this solution (all or part of it), then you’ll also need to overcome objections within your organization, and I’ll talk about that too, in a future article. But for now, I’d like to ensure that you’re approaching this solution with an open mind. So, what are some of the objections that I have heard?
- This is too complicated
- It’s going to be too expensive
- We’re going to have to do so much more work
- It’s going to slow us down
- Nobody knows how to do any of this stuff today
- It’s too difficult
- Shouldn’t this be someone else’s job, like the data engineering department?
I hear you. And I’ve heard these comments plenty of times. But, trust me on this for a few minutes and I promise that none of this is all that difficult to do and none of the objections are valid. Yes, if rephrased the objections as questions, they are great questions to ask when thinking about these solutions. But when the solutions are implemented, those objections aren’t valid at all and they almost completely opposite of reality. Again, I’ll dive into these in greater detail later, but for now, try to keep your mind open to the world of solutions because that’s why you’re here, right? There’s a problem that needs solving. So, let’s get into it.
Solutions Overview
For our comprehensive solution, we’re going to need a way to organize our code, organize our output files, ensure that we’re making our code and workbooks easy to debug, and avoid duplicating efforts so that we can avoid creating bugs and wasting time in the first place. Also, it would be great if we actually had documentation of how to use the code and dashboards as well as documentation around why we built and changed things. And as a bonus, if we could keep track of our tasks, we’d also help to reduce overlap, duplicate code, and bugs. In order to provide solutions within these areas, we have a few different software components and practices.
Oh, I almost forgot. As I discuss some of these solutions, please keep in mind that there are other software titles that you can use. What I describe below are some simple pieces of software that almost every organization is already using. If you have a software development team somewhere in your company, you probably already have all of this available. This isn’t to say that there isn’t something better. In some cases, there is certainly a better product (and I’ll call this out), but I wanted to provide a solution that is applicable to the broadest audience with the least amount of friction to get started. If you’d like to bolt on additional software or swap software out for a different product, that’s perfect. It’s your environment.
Below is a diagram of all of the components working and how they are connected.
Here we see the following:
- Jira — Task tracking and management. It’s a central “list” for all of your past and present work, details about what you did and why you did it, communication with others (past, present, and future). It’s the glue that holds almost all of this structure together.
- GitLab (GitHub, Git) — Code repository (central place for all of your code), version control, ability to diff code and track changes.
- Visualizations — I’m guessing you’re using this today. We don’t need a new piece of software, we just need to use what we have in a better way.
- Database — You almost certainly have this. We don’t need a new piece of software, we just need to use what we have in a better way.
- Job Scheduler — Automates the scheduling of your ETL jobs and makes sure that when you change code, it gets push to the database in a safe manner
- Cloud Server — Again, you already have this today to store your files. We just need to ensure that we are using it in the most optimal way
- Confluence — Documentation store. It’s usually paired with Jira and it’s a decent place to start documenting things. There’s many other ways to do document and ensure data governance, but this is a very easy starting point to reduce confusion, costs, and process overhead.
Let’s peel back the onion, so to speak, on each of these components to see what we need to do to get started and how all of this is supposed to work.
Getting Started
Jira
Jira is a task tracking and management tool and it’s the glue that holds everything together. This is because every task that you create has a “ticket number” associated with it. This ticket number then allows you to connect ever piece of work back to the original ticket. Why is this important? Well, if you think back to some of the challenges that we discussed, if you are looking at the end result of something, let’s say a dashboard, you probably don’t know why it was developed, who developed it, who requested it, and what it is trying to explain.
Or maybe there was a code change that happened. Again, you don’t know any of this information. Now, I’m sure some people will say, “Oh, but I just did this work and I know exactly why I did it.” Well, maybe true for the moment, but in 2 years will you know? Do your co-workers know? Will anyone know after organization changes or employee turn over? It’s doubtful. So why not take the doubt out of what was done and just go to the history?
Also, Jira not only provides the history and connects our work, it also serves as a project management tool. So, if you want to stay organized here’s something that will keep your team on track, allow you to reprioritize work, and allow you to report all sorts of stats to your management team. You get to see how much work is being requested, how much has been accomplished, and much more.
Cloud Server
One of the easiest things that you can do is to figure out how to organize you data so that teams know where to find things. For this configuration, we need things to be intuitive and we want to avoid duplication. This means creating a directory structure for your team or organization and then having everyone migrate their code off of their laptops and personal directories, and put the code in the shared location. But while this is a good start, you’re going to want to have good naming conventions to help tie the task or project work to any documentation, dashboards, or project management tasks.
You may have your own naming convention today, but we can enhance it even more by tying the Jira ticket number to your file and folder names. This way, when you look at an Excel document that was named, monthly_sales_output.xlxs, you don’t have to wonder so much about the who, what, when, or why questions. Instead, you have a name such as, sa_31_monthly_sales_output.xslx, that immediately tells you that if you go look at Jira, you find a ticket for SA-31 that explains everything about who asked for this file, why they needed it, when they asked for it, the code that was used to created it, and when it was delivered.

Git
Git is our code repository and it is the central location for storing your code. Just like you need to store your output files someplace, you need to store your code someplace. Now, maybe there’s a question as to why you can’t store these files in the same place. Technically, you can store them in the same place but it might not be the best idea.
The reason is because you don’t want to be committing (saving) your xlsx workbooks and data (in most cases) to your code repository. This is because you can’t track the changes of the file to see what actually changed, and these files can be massive in size. You’d be better off having some sort of version control or history of those files handled elsewhere (which is what we will do on the cloud server).
For my Git users out there, yes, you could just omit certain files from being able to be checked into Git, but then they show up as files when browsing your directory when you’re in your code editor and it’s really easy to accidentally delete some of these files as you’re working with code. It’s just best to keep them physically decoupled, which means that we need to logically keep them coupled. To do this, we’ll again look to Jira to start with.

As we see in the image above, we now have a Jira ticket that connects to our code and we have our code being stored in the cloud (Gitlab). This code is then synced through a manual process between the analyst’s laptop and the GitLab cloud server. It’s the same concept as cloud storage for your Microsoft One Drive or Google Docs, with the main difference being that with GitLab, the data sync is a manual process whereas the other cloud storage solutions have have an automatic sync configured. But there’s good reason for this and we’ll talk about that later. You don’t want to have automatic sync for your code, even if you think it would be a wonderful idea. Great in theory, but not in practice.
Now, we’ve talked about having Jira linked to code as well as the Excel output, but how do all three of these things connect?
Jira, Git, and Output
Below we see an image of the interconnectedness of our original tasks or ticket in Jira, how it the ticket links to the code used to pull data from the database, and the output file that was created based off of the execution of that code, and the result set that it produced. Notice the naming convention being used. The ticket number, SA-31, carries into a prefix for our ad_hoc code folder and file names. This prefix is also used on our output files and folders as well.
Everything is now connected. If you were to be randomly looking at the code in Git, you’d know exactly where to go to get more information about the who, what, where, when, and why questions. The same holds true for the .xlsx output. Less guessing, better organization, and quicker access and understanding.
Note: We use a folder for, sa_31_monthly_sales, as opposed to saving the xlsx file directly into the Ad-hoc Code folder because there is always the chance that we need to create multiple files to support a single request.

But we need to take this a step further. Did you notice the .xlsx naming convention? We have a file named, sa_31_monthly_sales_20210924_a3c6c.xlsx. Maybe you’re able to guess as what the, 20210924 means, but what about those other characters on the end? Below is an image that breaks down the naming convention components.

For the naming convention, we start by using the Jira ticket number, then a summary of what the file is, followed by the output date that you created the file on, and lastly, the Git sha. If you’re not familiar with the Git sha, it’s a unique identifier for a specific save point of the file. We’ll talk about this in more detail later, but it is the specific saved code that you used to generate the output. But why bother doing this? Isn’t it a lot of trouble?
No, it’s not much trouble at all. It’s just a few extra characters that you have to type. And if you’re working on a Jira ticket (which is asking you to perform a task), you should already know what that ticket number is. When it comes to the date, you just have to look at your task bar real quick to check the date. The Git sha is also not a poblem as it is something that you can look up as soon as you commit (save) your code. In a way, attaching this Git sha to your output forces you to save your code in Git, ensuring that you have it under version control and the you made a comment as to why you created or modified the code along the way.
Now, you might be asking, if you are using this convention on your .xlsx output, why don’t you use it on your code file? This is because 1. the Git sha is metadata to denote a version of the file. Since it’s a version of a file, we wouldn’t want to have the file name changing all of the time. 2. the date of the file is also metadata that can be looked up in our version control history. Again, there’s no reason to alter the file name. Technically you could give your files the same name, but I’ll explain more about this later and why it could cause confusion in a larger environment. Now anyone that looks at this file, based on the naming convention, they can understand or figure out all sorts of wonderful things.
Visualizations
We have a good structure for our code and our output, but what about our visualizations? They are a bit different because we aren’t storing the workbooks on a file server. This is because the final copy of the workbook is published to the visualization server (and that server has a structure for organization). But what about the working copy? Well, the thought here is that a working copy is very temporary in nature and you’ll want to ensure that you always have the latest version from the server before you being performing your updates. If you kept a local copy (either on your laptop or a cloud sever), you’d be at risk of having a stale file and accidentally overwriting the latest changes.
For example, let’s say you created a visualization file on 2020–01–01 and you published it to the Tableau or Power BI server on that day. A month later, another analyst checks out the workbook on 2021–02–01, makes a few changes, and publishes her version. Days after that, if you didn’t pull down the latest copy from the server, you’d be using your copy from 2020–01–01, without the changes from 2021–02–01 that were just published. And when you make updates and publish to the server, you’re going to overwrite someone else’s modifications.
This is one of my main complains about these visualization tools. They don’t offer any proper version control or protections. When you’re committing your code to Git, Git is forcing you to make sure that you have the latest changes pulled into your version before you can update your code on the Git server. You can’t accidentally overwrite changes when working with Git (unless you alter the default configuration to do some pretty risky things). But even though we don’t have a whole lot to worry about when dealing with the visualization file naming convention or keeping our workbook in sync with anything, we do need to think about how data connects to the visualization given all of the challenges that we need to overcome. To solve this, we’re going to have to chain a few things together and here’s what we’re going to do.
- We’re going to want to have a copy of the visualization datasource code saved in Git. But this can introduce issues, so we’re going to try to create the most minimal amount of code possible to write. But how do you minimize hundreds of lines of code? By creating tables or views.
- Create tables or views, that will contain all of the logic. We’ll just tell the visualization to call the view in order to keep things very simple.
- If we’re using a Table, we are going to need to refresh the data, so we’ll have to schedule the refresh through a task scheduler.
- We need to create good documentation so that people can understand all of the important details related to the dashboard.
Below is an image of what this configuration looks like.

Here’s what is happening:
First, we need to create the code that will generate the result set (the data that the dashboard needs). But after we create it, we’re going to push save it as a View, or we are going to create a reporting Table. This will ensure that anyone (individual) or anything (the visualization) will not have to have the code saved in multiple places. We’re minimizing the chances that this code can be duplicated.
Second, we need to have the visualization call the Table or View so that the visualization can get the data that it needs. The SQL for this simply, “select * from table_name”. When we create a datasource in our visualization, we could simply type in that SQL statement. However, due to all of the challenges with figuring out what code was used, we’re going to document this by saving a copy of this statement to a file, and then save this file in Git.
If you look at the image above, you can see that we have a create_sales_kpi_view_for_tableau.sql file. This is where the meat of the query is at. Those hundreds of lines of logic is saved in the View. Next, the View is pulled over to a scheduling service (we’ll talk more about this later) to ensure that a human doesn’t need to manually refresh the View code or the Table data. When this code is executed, it creates the Table or View on the server.
Now, from Tableau or Power BI, we’re going to write a “select * from user_sales_view_for_tableau” and save that as our custom SQL datasource. Last, we’re going to copy that exact statement and save it as, “sales_kpi_for_tableau.sql”, because that is the name of the datasource that we’re creating in the visualization. Now, if you’ve been following along, you might guess that I’m not thrilled about this last part. I don’t like making a manual copy of code to do this, but due to the lack of version control and decoupling of datasource code from the visualization workbook, this is the best that we can do for now. Is it necessary to do this last step?
No, it isn’t completely necessary because it’s not like the visualization ever looks at or is connected to that file. However, we do this to allow the analyst to quickly understand what datasources were created and what code was used, instead of forcing the analyst to jump through a number of hoops as we mentioned in our previous articles.
Scheduler
The purpose of the scheduler is to take the human out of the process. And by taking the human out of the process, you’ll reduce the level of effort needed and reduce the chance for bugs to be introduced.
The job of the scheduler is to check-out the latest code from Git and then run the create or replace table or view statements on a scheduled basis (as needed based on your team needs). The other nice thing about the scheduler is that it can allow you to chain jobs together and have dependencies. For example, let’s say that you have a monthly sales report and a weekly sales report. To keep your code as DRY (don’t repeat yourself) as possible, you’ve decided that in order to generate the monthly sales data, you can simply summarize the weekly data. This means that your monthly sales dataset is dependent on the weekly sales dataset. This also means that if the weekly sales data refresh job fails for some reason, there’s no point in running the monthly sales data job, because it’s either not going to have any new data or it is going to fail due to the dependency.
If you are trying to schedule these jobs in a simplistic scheduling engine such as with Google Big Query, you can get the benefits of automation. However, you won’t be able to chain your jobs together, which can ultimately cause confusion with debugging and broken datasets and dashboards. Also, you won’t be able to automatically pull the necessary code from Git, which means you’ll have to manually copy/past that code into this simplistic scheduler. And as you know, when you manually copy/paste code, you’re exposed to bugs when someone forgets to perform this task or when the clipboard doesn’t copy/paste the code correctly.
Documentation
The last item to discuss is documentation and it is the last topic in this article because after you finish building or modifying something, you should document your changes. Ironically, it also happens to be the last thing that anyone seems to ever want to do. And that’s unfortunate, because it’s an extremely important part of what we build.
Failure to document leads to confusion, assumptions, and misunderstandings. Now on rare occasions, I have crossed paths with some developers that don’t believe in documentation but I think that’s nonsense. Would you want the pilot of your airplane to have never read the manual on how to fly the airplane? I would assume not. But when it comes to analytics, it really seems like many people are okay without documentation, or at least okay enough to not make a it a priority to have it on hand. Yet dealing with data without documentation isn’t much different than the pilot flying the plane without having read the manual.
Sure, analyst have some experience and yes, many are capable of figuring out problems. But they can’t figure out a problem if they don’t think that there is a problem in the first place. And who wants to have to read a bunch of code and figure something out every time you need to understand a field in a table?
So, when we look at the documentation component in our diagram at the top of the page, you’ll see that everything is connected to the documentation. We have Jira tickets that we create, which are tasks asking the analyst to create documentation. And since there’s a task or ticket created, there’s no reason to forget to do the work. You’ll also see that we create documentation for our Tables, Views, and Visualizations. Now, some of you might be saying, “I document my visualizations within the visualization, why would I ever document outside of it?”. The reason for this can be found in our discussion of challenges around visualizations.
If you document within the visualization, you have to touch the file (permissions, downloads, time, potential bugs) just to provide more information to the end user. Given all of the potentials for issues and how long it takes, it would be really easy to use this as an excuse to not update your documentation. Also, there usually isn’t enough room to properly document things (such as an FAQ section for my dashboard to help explain common questions or point out anomalies and explain why the occurred).
Conclusion
Using this architecture, you can solve all of the problems that we covered in the previous articles. I hope that you can take an opportunity to step back, review the diagram at the top of the page, and think about this and how you can make this work within your organization. In Part 7, we’ll cover how to roll this out to your organization and some of the challenges that you might face.
Subscribe to Receive New Articles
Join our mailing list to receive the latest articles and tips to elevate your career.
We hate SPAM. We will never sell your information, for any reason.
